ICT Timestamps – Mentorship 2022 Episode 2 | Full Study Notes + Real Setup Breakdown
🧠 These are my personal study notes from Episode 2 of ICT’s “2022 Mentorship” series.
All credit belongs to ICT. I’m a student sharing how I study and apply his lessons — especially in Forex using mechanical strategies.
👉 Prefer A Fast Summary? Watch the 1-minute Video Below.
⏱️ ICT Mentorship Episode 2 – Timestamped Clickable YouTube Links
| ⏱️ Timestamp | 📝 Topic | 🔗 Direct Link |
|---|---|---|
| 00:13 | First Official Teaching: Elements of a Trade Setup | ▶️ Watch at 0:13 |
| 01:07 | Focus: Futures Index Trading Using TradingView | ▶️ Watch at 1:07 |
| 03:18 | Picking the Most Valuable Trade | ▶️ Watch at 3:18 |
| 04:41 | What Makes a Handle & Why It Matters | ▶️ Watch at 4:41 |
| 06:00 | Micro Contracts vs Full Futures | ▶️ Watch at 6:00 |
| 07:18 | Chart Cleanliness & Trader Independence | ▶️ Watch at 7:18 |
| 09:15 | Finding Frameworks That Repeat | ▶️ Watch at 9:15 |
| 11:06 | Moving Beyond Small Scalps | ▶️ Watch at 11:06 |
| 13:01 | Weekly Candle Bias: A Key Starting Point | ▶️ Watch at 13:01 |
| 17:16 | Sell Stops, Buy Stops & Price Draw | ▶️ Watch at 17:16 |
| 18:50 | Imbalances, Not Supply & Demand | ▶️ Watch at 18:50 |
| 19:45 | Weekly to Hourly: Top-Down Framework | ▶️ Watch at 19:45 |
| 21:00 | Inducing Shorts Before Running Buy Stops | ▶️ Watch at 21:00 |
| 25:10 | Equal Highs, Breaker Blocks & Setup Signature | ▶️ Watch at 25:10 |
| 27:00 | Fair Value Gap + Entry Logic | ▶️ Watch at 27:00 |
| 31:00 | Why the Algorithm Matters More Than Pressure | ▶️ Watch at 31:00 |
| 35:30 | Premium/Discount & Liquidity Matrix | ▶️ Watch at 35:30 |
| 38:00 | Finding the Final Target Below 50% | ▶️ Watch at 38:00 |
| 44:00 | Focus on One Clean Trade, Not Scalps | ▶️ Watch at 44:00 |
| 47:01 | Homework: Break in Market Structure + FVG | ▶️ Watch at 47:01 |
🕒 Timestamped Study Notes – ICT Mentorship 2022 Episode 2
00:13 – First Official Teaching: Elements of a Trade Setup
This is the first real teaching session. ICT reminds us to watch the intro video first — it sets expectations and explains what this mentorship is (and isn’t).
01:07 – Focus: Futures Index Trading Using TradingView
This mentorship centers on index futures (mainly NASDAQ).
He’ll demonstrate with real trades on ThinkorSwim, but wants students to paper trade using TradingView.
No pressure to trade live — focus is on learning, not risking.
03:18 – Picking the Most Valuable Trade
ICT asks: “If you could only take one of today’s setups… which would you pick?”
He’s not teaching how to take every trade — he’s teaching how to spot the best one.
04:41 – What Makes a Handle & Why It Matters
Explains how “handles” = full-point moves.
- On ES: 1 handle = 4 ticks = $50
- On NQ: 1 handle = $20
Learning to measure setups in handles is key to managing expectations and goals.
06:00 – Micro Contracts vs Full Futures
Micro contracts are for most students — way lower margin.
You don’t need $177,000 to trade full NASDAQ.
ICT supports trading micro futures as a training ground with lower risk.
07:18 – Chart Cleanliness & Trader Independence
No indicators. No graffiti.
He wants students to read clean price action, without being trapped by signal services or “black box” systems.
09:15 – Finding Frameworks That Repeat
The real value isn’t in the exact entry — it’s in seeing the frameworks that repeat.
Framework = bias, liquidity, and price draw logic.
That’s what leads to consistent setups.
11:06 – Moving Beyond Small Scalps
He’s not teaching 3–5 handle scalps.
Instead, he shows trades with 50–100+ handles using context and structure.
This is a precision-based swing model, not algo-style micro scalping.
13:01 – Weekly Candle Bias: A Key Starting Point
Before trading, always ask:
👉 Is the weekly candle likely to expand higher or lower this week?
That weekly bias drives everything. Set it on weekends. Don’t skip this.
17:16 – Sell Stops, Buy Stops & Price Draw
Markets gravitate toward liquidity (stops) or imbalances.
Think of price as a paperclip, and liquidity zones as magnets.
Smart money hunts for stops before making the real move.
18:50 – Imbalances, Not Supply & Demand
He’s clear: this is not classic supply/demand theory.
ICT teaches Fair Value Gaps (FVG) as the real imbalances that the algo fills — nothing random.
19:45 – Weekly, Daily, to Hourly: Top-Down Framework
Start with weekly bias → drop down to daily → drop to hourly.
Then you can zoom in to find precision setups inside those levels.
21:00 – Inducing Shorts Before Running Buy Stops
Smart money often drops first (to trap breakout sellers), then runs price up to hit stops.
It’s a trap → spike → reversal move.
This pattern repeats across sessions and days.
25:10 – Equal Highs, Breaker Blocks & Setup Signature
Look for relative equal highs → then break in market structure
This signals shift in control — and the setup begins to form.
ICT calls it a “signature” — like a fingerprint. It repeats often.
27:00 – Fair Value Gap + Entry Logic
Once you see BMS (Break in Market Structure), draw out the FVG.
That’s your entry zone.
Wait for price to retrace into the gap — don’t chase it.
31:00 – Why the Algorithm Matters More Than Pressure
ICT rejects the “buying/selling pressure” narrative.
He says price is moved by a deliberate algorithm targeting liquidity, not retail sentiment.
35:30 – Premium/Discount & Liquidity Matrix
Learn to divide price into Premium (above 50%) and Discount (below 50%).
If short: you want to enter in premium, exit in discount.
This is key to understanding smart money logic.
38:00 – Finding the Final Target Below 50%
He shows how to measure the range → target areas below 50%
Look for imbalances or old lows near that zone = likely draw.
44:00 – Focus on One Clean Trade, Not Scalps
He’s not teaching to chase every move.
Just one clean trade, using bias, stops, structure, and imbalance = enough.
47:01 – Homework: Break in Market Structure + FVG
Your task:
- Find a run on liquidity (old high/low)
- Then look for a BMS + FVG on the lower time frame
- Log it, measure handles, and repeat
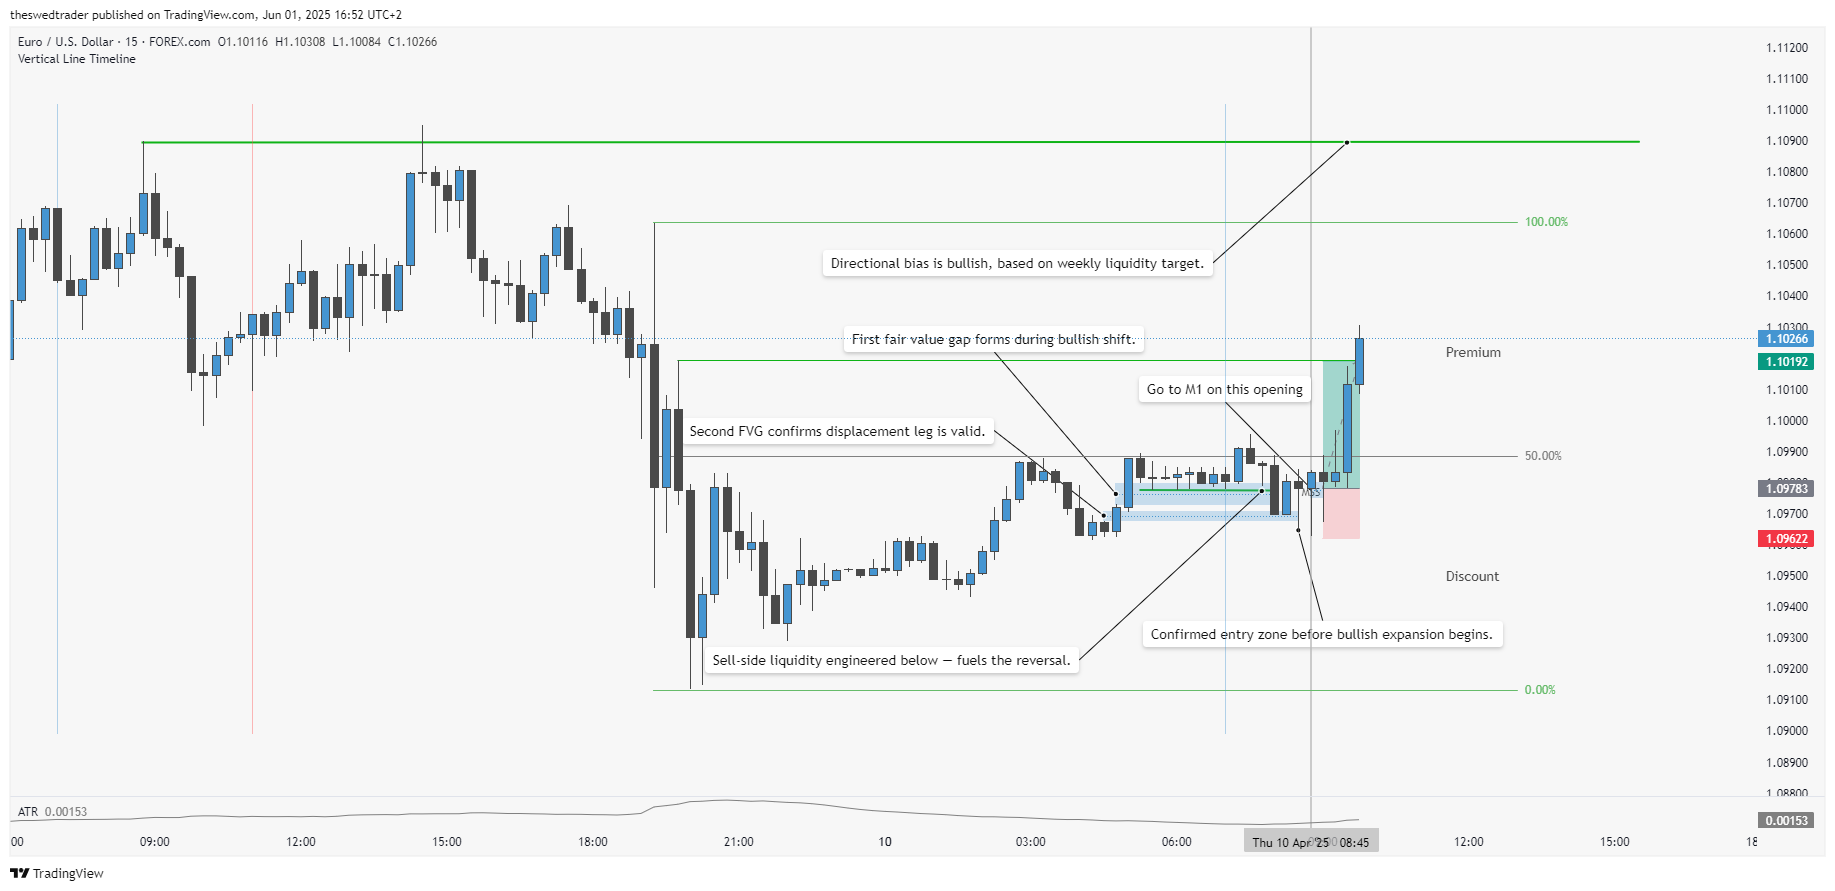
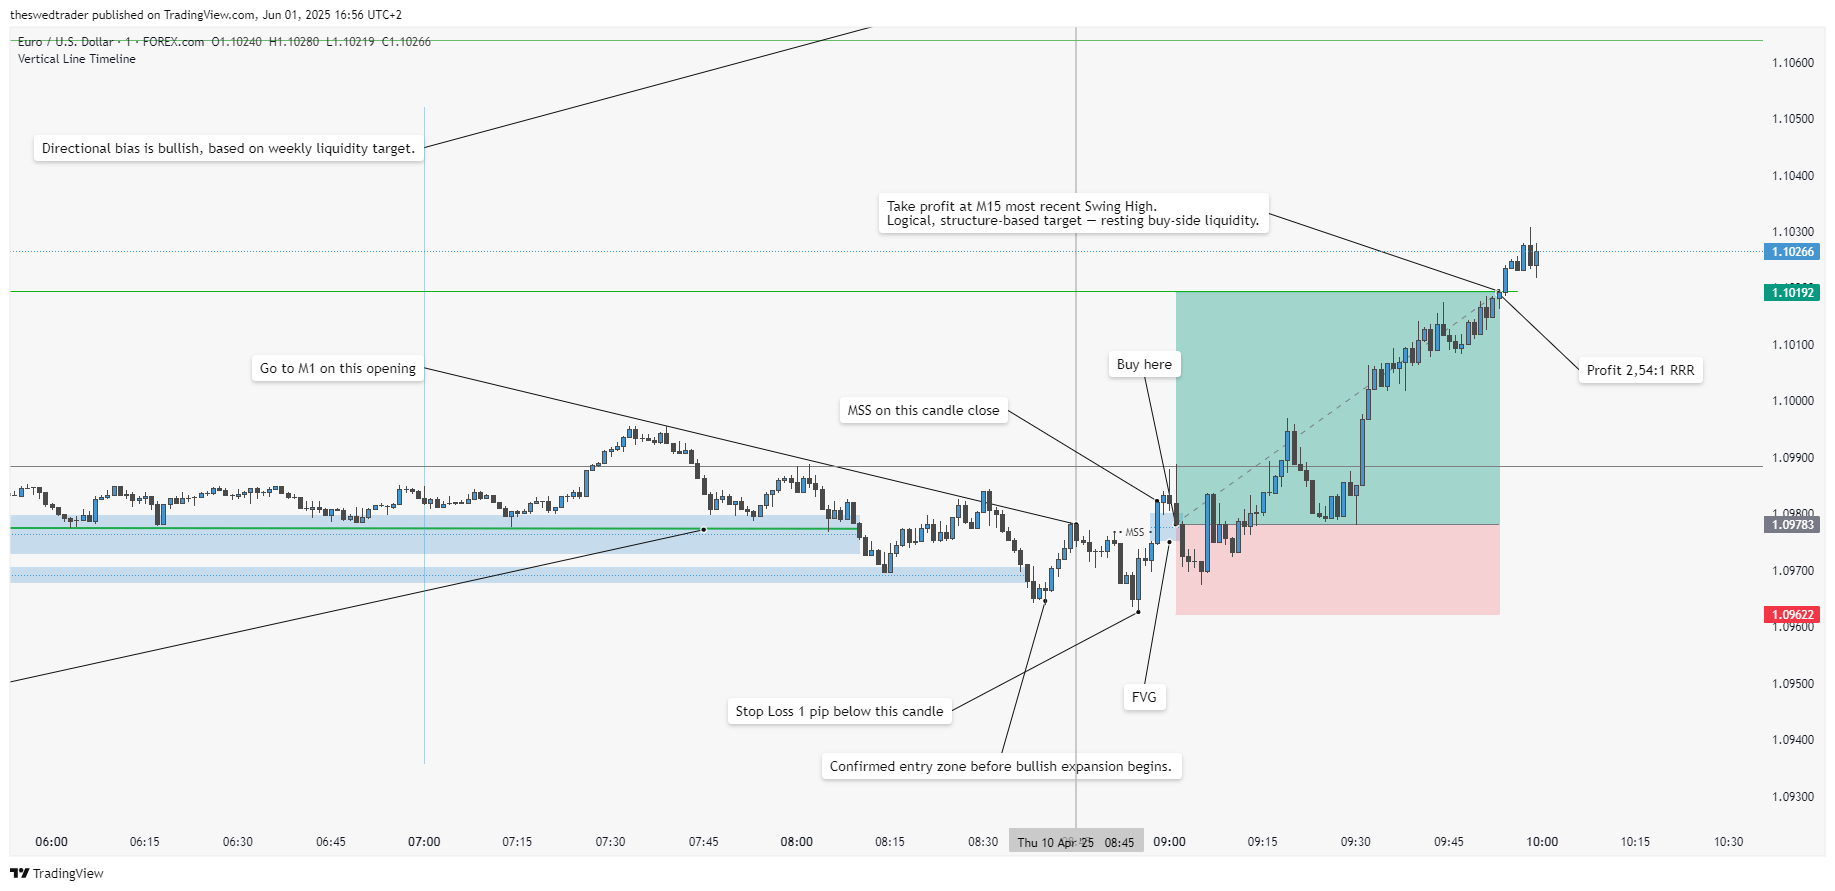
🧭 Example: Applying ICT Concepts to EUR/USD Using M15 → M1 Breakdown
Here’s a example on EUR/USD that follows the model ICT teaches in Episode 2.
We start on the M15 chart for context and bias, then refine the entry using the M1 chart.
🔍 Step 1: Determine Higher Timeframe Bias (M15)
On the M15 chart, I saw Weekly Relative Equal Highs as the likely draw.
That gave me a clear bullish bias — I expected price to trade higher to clean out buy-side liquidity.
At this point, I’m not looking for signals. I’m watching for structure and liquidity — just like ICT teaches.
💧 Step 2: Confirm Liquidity Engineering
Still on M15, price had recently formed Relatively Equal Lows.
That tells me sell stops are resting below.
Then, price dipped down and filled the lowest FVG — likely taking out those sell stops and engineering liquidity.
This is exactly what ICT describes: a false move to the downside before a real move higher.
🧠 Step 3: Wait for a Market Structure Shift (MSS)
After liquidity is swept, I wait for price to show a shift in structure.
On M15, I marked the candle where bullish structure begins to shift. That’s my signal to drill down.
🔁 Step 4: Drop to M1 for Entry Setup
On the M1 chart, I look for the same key ingredients:
- Liquidity grab ✅
- MSS confirmed ✅
- Fair Value Gap (FVG) ✅
I waited for price to retrace into the FVG after MSS, and entered inside the gap.
Entry was clean and mechanical — no guessing. Just structure + FVG = go.
🛡️ Step 5: Define Risk
Stop Loss was placed 1 pip below the most recent Swing Low on M1.
This keeps it tight, controlled, and follows ICT’s mechanical logic.
🎯 Step 6: Set Logical Target
Take profit was set at the M15 most recent swing high — which lines up with buy-side liquidity.
No greed, no guessing — just a logical liquidity target.
💰 Result: 2.54R Trade
Risk was fully defined, and the trade delivered a 2.54:1 reward-to-risk ratio.
That’s all I need. Just one clean, mechanical setup like this — and walk away.
📝 Final Thoughts
This is how I apply ICT’s teachings step by step:
- Start with higher timeframe draw (M15/Weekly)
- Wait for liquidity sweep
- Look for MSS + FVG
- Drop to M1 for precision
- Enter mechanically, define risk, target structure
It’s not about signals or indicators.
It’s about reading price, trusting the process, and keeping it simple.
👉 Prefer A Fast Vertical Summary? Watch the 1-Minute Shorts Version Below.
📘 Glossary – Key Concepts from ICT Mentorship Episode 2
Handle
A full-point move in futures.
- On ES: 1 handle = 4 ticks = $50
- On NQ: 1 handle = $20
ICT uses this to measure trade potential and outcome precision.
Liquidity
Where retail stop orders are likely resting.
- Buy-side liquidity = buy stops above old highs
- Sell-side liquidity = sell stops below old lows
Smart money seeks these areas before big moves.
Price Draw
Price moves toward something — not randomly.
It’s “drawn” like a paperclip to a magnet.
Common draws:
- Old highs/lows
- FVGs (imbalances)
- Session opens or previous day levels
Market Structure Break (BMS)
A break of a prior swing high/low.
It signals that the short-term control may be shifting — and a setup could be forming.
Fair Value Gap (FVG)
A one-sided price movement — either all buying or all selling — that leaves an imbalance between candles.
ICT uses this as a precision entry zone.
Imbalance vs Supply/Demand
ICT does not teach traditional supply & demand.
He teaches imbalances like FVGs, which act as algorithmic targets — not reaction zones.
Premium vs Discount
Use the 50% midpoint of a price range:
- Above 50% = Premium (expensive)
- Below 50% = Discount (cheap)
If bearish → look to short from premium to discount
If bullish → long from discount to premium
Liquidity Matrix
ICT’s internal model of how price hunts liquidity before moving toward its target.
He teaches that price is engineered, not chaotic.
Micros vs Full Contracts
Micro contracts = smaller risk and margin.
ICT encourages learning with micro futures or paper trading to reduce pressure while learning the model.
Independence Model
ICT doesn’t want you reliant on:
- Signal services
- Indicator tools
- Discord groups
He teaches a repeatable structure you can apply solo.
Framework
The full setup logic:
- Bias (weekly/daily)
- Liquidity sweep
- BMS
- FVG
This is what you’re aiming to recognize and master — not just entries.
⚠️ Disclaimer
These are my personal notes as an ICT student.
I do not represent ICT and I’m not teaching his material — I’m just sharing how I study and apply it in my own trading journey.
All credit for original concepts belongs to Inner Circle Trader (ICT).
👉 Learn directly from the source: Inner Circle Trader on YouTube
🔗 Useful Links
🎥 Watch the original video on YouTube
👉 ICT Mentorship 2022 – Episode 2
🧠 See all my ICT-based study notes with timestamps, glossary & examples
👉 Browse articles on TheSwedTrader.com
📈 Want more visual breakdowns like this?
I’m documenting my full ICT learning journey — with notes, charts, and honest reflections from a student’s perspective.
🎥 Subscribe on YouTube to get:
- Real Forex examples based on ICT
- Full widescreen breakdowns (16:9)
- Fast vertical summaries (9:16)
- No fluff. Just structure, logic, and execution.
👉 Subscribe to TheSwedTrader on YouTube
💡 Bonus tip: Bookmark this site if you’re studying ICT too. I post everything I learn — no secrets.