Stressed trader sitting at desk after a loss, surrounded by multiple monitors showing trading charts – illustrating revenge trading.

✅ Trading Psychology EP 3: The Fog of Hesitation After a Loss

Have you ever stared at a perfect setup… and couldn’t pull the trigger? You froze.You hesitated.You didn’t take the trade — and watched it run exactly as expected. It happens to almost every trader, especially after a recent loss.This hesitation isn’t about the chart.It’s about trust — trust in yourself. What Is Post-Loss Hesitation? Hesitation…


Focused young trader analyzing candlestick charts on multiple monitors in a sunlit room with soft blue tones

Trading Psychology EP 2: The Silent Burnout of Overtrading

Every candle feels like a chance. Every minute without action feels like a mistake. Overtrading doesn’t always look like panic — sometimes it’s disguised as dedication. Traders who overtrade often think they’re working hard… until their account balance quietly disagrees. 🧠 What is Overtrading? Overtrading happens when a trader takes more trades than their strategy…

Trader experiencing frustration while looking at trading charts after a losing trade

Trading Psychology EP 1: The Hidden Danger of Revenge Trading

Have you ever felt the urge to immediately enter a new trade right after a losing one?That’s revenge trading.And it quietly destroys more trading accounts than most people realize. What Is Revenge Trading? Revenge trading happens when emotions take control after a loss.Instead of following your plan, you feel the need to “get your money…

ICT Timestamps – Mentorship 2022 Episode 3 full study notes and glossary by TheSwedTrader
|

ICT Timestamps – Mentorship 2022 Episode 3 | Full Study Notes + Glossary

📌 These are my personal study notes from Episode 3 of ICT’s “2022 Mentorship” series. All credit belongs to ICT. I’m a student sharing how I study and apply his lessons — especially in Forex using mechanical strategies. 🎯 ICT Mentorship Episode 3 – Timestamped Clickable YouTube Links Timestamp Topic Direct Link 00:17 Introduction &…

ICT Timestamps Episode 2: Full Study Notes and Real Trade Setup Breakdown from ICT Mentorship 2022
|

ICT Timestamps – Mentorship 2022 Episode 2 | Full Study Notes + Real Setup Breakdown

🧠 These are my personal study notes from Episode 2 of ICT’s “2022 Mentorship” series.All credit belongs to ICT. I’m a student sharing how I study and apply his lessons — especially in Forex using mechanical strategies. 👉 Prefer A Fast Summary? Watch the 1-minute Video Below. ⏱️ ICT Mentorship Episode 2 – Timestamped Clickable…

Clock icon and candlestick chart with the text ICT Timestamps – ICT Mentorship 2022 Introduction – Study Notes and Glossary
|

ICT Timestamps – ICT Mentorship 2022 Introduction – Study Notes + Glossary

🧠 These are my personal study notes from ICT’s “Mentorship 2022 Introduction” video. All credit belongs to ICT. I’m an ICT student documenting what I learn and how I apply it — especially in the Forex market using mechanical strategies. 👉 Prefer A Fast Summary? Watch the 1-minute Video Below. 📘 ICT Mentorship 2022 Introduction…

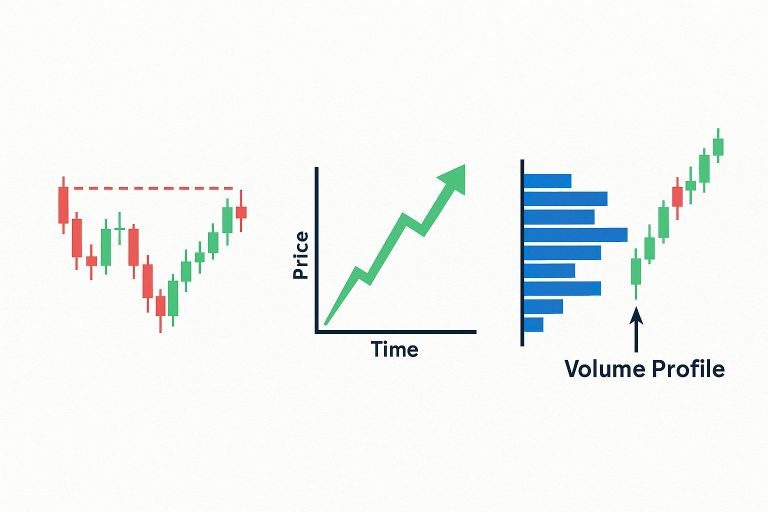
Three-part illustration comparing classic candlestick charts, a time-based price trend, and a volume profile chart, showing market microstructure concepts.

Market Microstructure & Volume Analysis – Part 1

What’s Missing in Classic Candlestick Charts? 🔍 Why Candlesticks Aren’t Telling You the Whole Story Traditional candlestick charts are useful — they show you open, high, low, and close over a period of time. But here’s the problem: They don’t show how price moved. Was the move driven by heavy buying or just a lack…

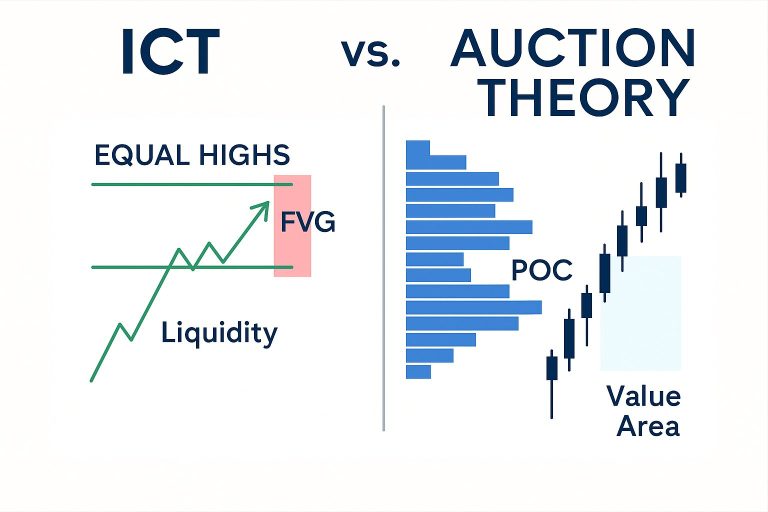
Side-by-side comparison of ICT trading concepts and Auction Theory. The ICT side shows equal highs, liquidity, and a Fair Value Gap. The Auction Theory side shows a volume profile, Point of Control (POC), and value area with candlestick chart.
|

ICT Concepts VS Tools Like Footprint Charts, POC, Volume Profile, Auction Theory, and Sierra Chart

You said: If you compare ICT (Inner Circle Trader) concepts with tools like Footprint Charts, POC, Volume Profile, Auction Theory, and Sierra Chart, what is your thoughts? ChatGPT said: Comparing ICT (Inner Circle Trader) concepts with tools like Footprint Charts, POC, Volume Profile, Auction Theory, and Sierra Chart is extremely fruitful. They come from different…