ICT Timestamps – Mentorship 2022 Episode 3 | Full Study Notes + Glossary
📌 These are my personal study notes from Episode 3 of ICT’s “2022 Mentorship” series. All credit belongs to ICT. I’m a student sharing how I study and apply his lessons — especially in Forex using mechanical strategies.
🎯 ICT Mentorship Episode 3 – Timestamped Clickable YouTube Links
| Timestamp | Topic | Direct Link |
|---|---|---|
| 00:17 | Introduction & Lecture Topic | Watch at 0:17 |
| 01:14 | Chart Walkthrough Begins | Watch at 1:14 |
| 02:12 | Sell-Side and Buy-Side Liquidity | Watch at 2:12 |
| 03:05 | Market Structure Shift vs Break | Watch at 3:05 |
| 06:31 | High-Frequency Algorithms | Watch at 6:31 |
| 13:05 | Order Blocks Explained | Watch at 13:05 |
| 18:00 | Intraday Trade Logic | Watch at 18:00 |
| 33:00 | Key Session Times | Watch at 33:00 |
| 35:02 | Internal Range Liquidity | Watch at 35:02 |
| 40:05 | Backtesting Homework | Watch at 40:05 |
| 41:06 | Live Trading Example Begins | Watch at 41:06 |
| 52:14 | Conclusion | Watch at 52:14 |
📝 Timestamped Study Notes
00:17 – Introduction & Lecture Topic
ICT introduces two major topics for this episode: Internal Range Liquidity and Market Structure Shift (MSS) — two of his most critical building blocks for reading price action.
01:14 – Chart Walkthrough Begins
ICT breaks down a 15-minute Nasdaq chart, identifying old lows and equal highs, emphasizing the constant presence of buy-side and sell-side liquidity pools.
02:12 – Sell-Side and Buy-Side Liquidity
- Sell-Side Liquidity: resting stop orders under old lows.
- Buy-Side Liquidity: resting stop orders above equal highs.
- Price constantly hunts these pools — grabbing one side and then often targeting the opposite.
03:05 – Market Structure Shift vs Break
ICT clarifies an important distinction:
- Market Structure Break (MSB): long-term bias shifts.
- Market Structure Shift (MSS): short-term intraday reversals after liquidity grabs.
- Intraday shifts are actionable for day traders; breaks imply longer moves.
06:31 – High-Frequency Algorithms
High-frequency algorithms (HFTs) hunt liquidity on micro-timeframes (3m, 2m, 1m, even sub-minute). ICT explains:
- Algorithms trigger once liquidity is cleared.
- Short-term swing highs/lows define algorithmic state shifts.
13:05 – Order Blocks Explained
ICT defines his core “Order Block” concept as a change in state of delivery:
- Example: Bullish Order Block forms when price closes below liquidity, then reclaims that zone.
- Key location for precise entries when aligned with MSS and FVG.
18:00 – Intraday Trade Logic
ICT shows how traders can apply MSS + Liquidity + Order Blocks intraday, using Nasdaq as illustration but emphasizes full cross-asset relevance (Forex included).
33:00 – Key Session Times
ICT defines the 3 critical trading windows:
- London: 02:00 – 05:00 (NY time)
- New York: 07:00 – 10:00 (NY time)
- Asia: 19:00 – 21:00 (NY time)
35:02 – Internal Range Liquidity
Internal range liquidity = short-term highs and lows within price legs that hold stop orders or imbalances. These act as intraday targets.
40:05 – Backtesting Homework
ICT challenges students to manually annotate intraday MSS setups from past data:
- Targeting stop hunts + structure shifts
- Journaling patterns across 3m, 2m, 1m charts
- Building pattern recognition via repetition
41:06 – Live Trading Example Begins
ICT demonstrates live executions using TD Ameritrade + TradingView — reinforcing his process:
- Liquidity grab → MSS → FVG → Trade entry → Partial exits.
- Real-money executions provide confidence in the repeatability of his model.
52:14 – Conclusion
- Simplicity wins.
- Master liquidity, structure shifts, timing.
- Deep backtesting builds confidence.
- Ignore outside noise; focus on the algorithmic model.
📊 Forex Adaptation: How I Apply ICT’s Concepts
While ICT teaches Nasdaq futures, I apply his system directly to Forex pairs like EUR/USD and GBP/USD. The core logic is fully transferable.
My Mindset
- Study structure, not signals.
- Trade mechanically, not emotionally.
- Accept uncertainty — follow probabilities.
Demo vs Live
- I use both demo and live accounts.
- Track every trade via my mechanical system for repeatability.
Simplification Toolkit
- Fair Value Gaps (FVG)
- Session windows
- Liquidity pools
- Confirmation candles
- MSS validation
Session Timing (Forex Translation)
| ICT Session | My Stockholm Time |
| Frankfurt-London | 07:00 – 11:00 |
| NY Overlap | 13:00 – 16:00 |
Strategic Reasoning
- Frankfurt often triggers early liquidity sweeps.
- London Open completes Judas swings.
- NY Open reflects US data shocks (ICT’s 08:30 focus).
My Core Mechanical Rules
- No trades outside defined sessions.
- MSS must align with liquidity direction.
- FVG entries only inside pre-defined bias.
- Strict checklist governs every trade.
💡 Personal Takeaways
- MSS + Liquidity = my trading foundation.
- Pattern repetition is more important than precision.
- The model is simple but demands patience.
- My edge grows through annotated study journals.
- Mechanical rules protect my emotions.
📚 Glossary – Key ICT Concepts Explained
Market Structure Shift (MSS)
The key intraday signature where price reverses direction after clearing liquidity.
Order Block
A change in state of delivery where previous selling flips into new buying (or vice versa), often marked by a strong candle cluster.
Internal Range Liquidity
Short-term highs and lows within larger price swings, used as micro liquidity targets.
Liquidity Pools
The price zones where stop orders cluster:
- Buy-side: Above recent swing highs.
- Sell-side: Below recent swing lows.
Fair Value Gap (FVG)
A small price imbalance between consecutive candles that price often rebalances before continuation.
High-Frequency Algorithms
Ultra-fast algorithms that trigger trades on micro-timeframes after liquidity clears.
Change in State of Delivery
When price switches from offering liquidity on one side (sell-side or buy-side) to the other, often confirmed by MSS + OB.
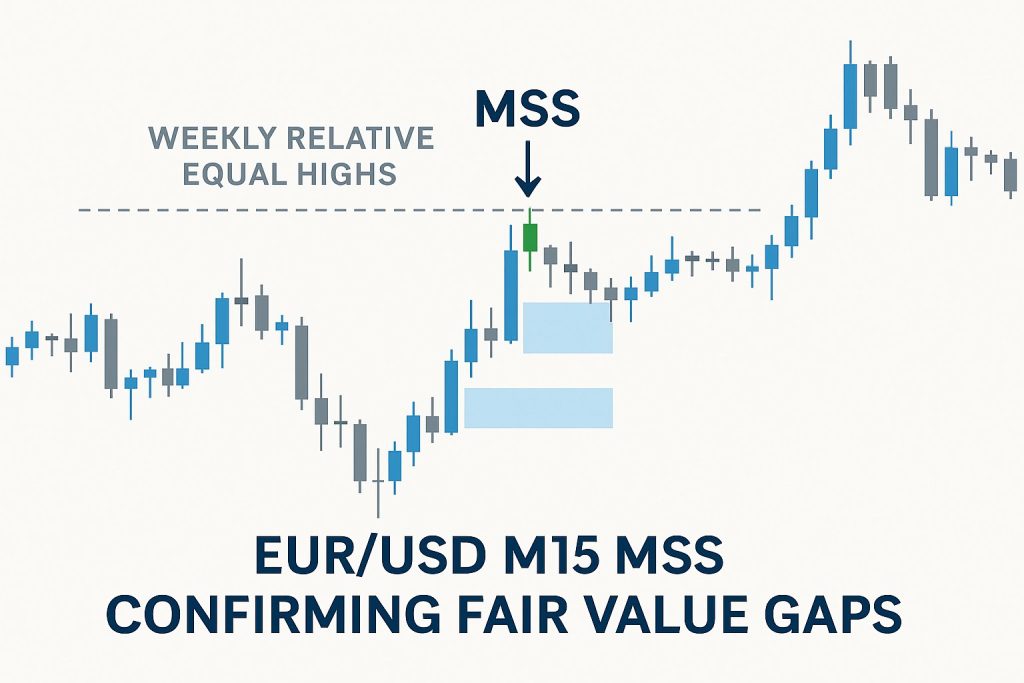
🖼 Optional SEO Insert:
(Insert custom chart here illustrating Market Structure Shift + Liquidity Sweep + Order Block for SEO purposes)
⚠️ Disclaimer
These are my personal notes as an ICT student. I do not represent ICT and I’m not teaching his material — just sharing how I apply it in my trading journey. All credit for original concepts belongs to Inner Circle Trader (ICT).
👉 Learn directly from ICT: InnerCircleTrader YouTube Channel
🔗 Useful Links
- Watch the original Episode 3 on YouTube
- See all my ICT-based study notes
- See ICT Timestamps – Mentorship 2022 Episode 2 | Full Study Notes + Real Setup Breakdown
🎥 Follow My Full ICT Journey
I’m documenting everything — real notes, Forex charts, honest lessons from a student’s view.
Subscribe to TheSwedTrader on YouTube to get:
- Real Forex examples based on ICT
- Full widescreen breakdowns (16:9) + quick vertical summaries (9:16)
- Ongoing study content — no fluff, just real learning
👉 Subscribe to TheSwedTrader on YouTube
💾 Bonus tip: Bookmark this site if you’re studying ICT — I share everything.