ICT Concepts VS Tools Like Footprint Charts, POC, Volume Profile, Auction Theory, and Sierra Chart
You said:
If you compare ICT (Inner Circle Trader) concepts with tools like Footprint Charts, POC, Volume Profile, Auction Theory, and Sierra Chart, what is your thoughts?
ChatGPT said:
Comparing ICT (Inner Circle Trader) concepts with tools like Footprint Charts, POC, Volume Profile, Auction Theory, and Sierra Chart is extremely fruitful. They come from different worlds but can complement each other beautifully when understood correctly. Here’s a high-level breakdown of how they compare — and where they intersect:
🔍 1. Core Focus Differences
| Concept | Focus | Style |
|---|---|---|
| ICT | Liquidity, market maker models, smart money concepts, time-based entry setups | Discretionary, narrative-based |
| Volume Profile / Auction Theory | Price acceptance and rejection based on volume and time | Structural, data-driven |
| Footprint Charts | Order flow at the bid/ask level | Microstructure, scalper/intraday focused |
🧠 2. How They Can Complement Each Other
🟢 ICT gives you:
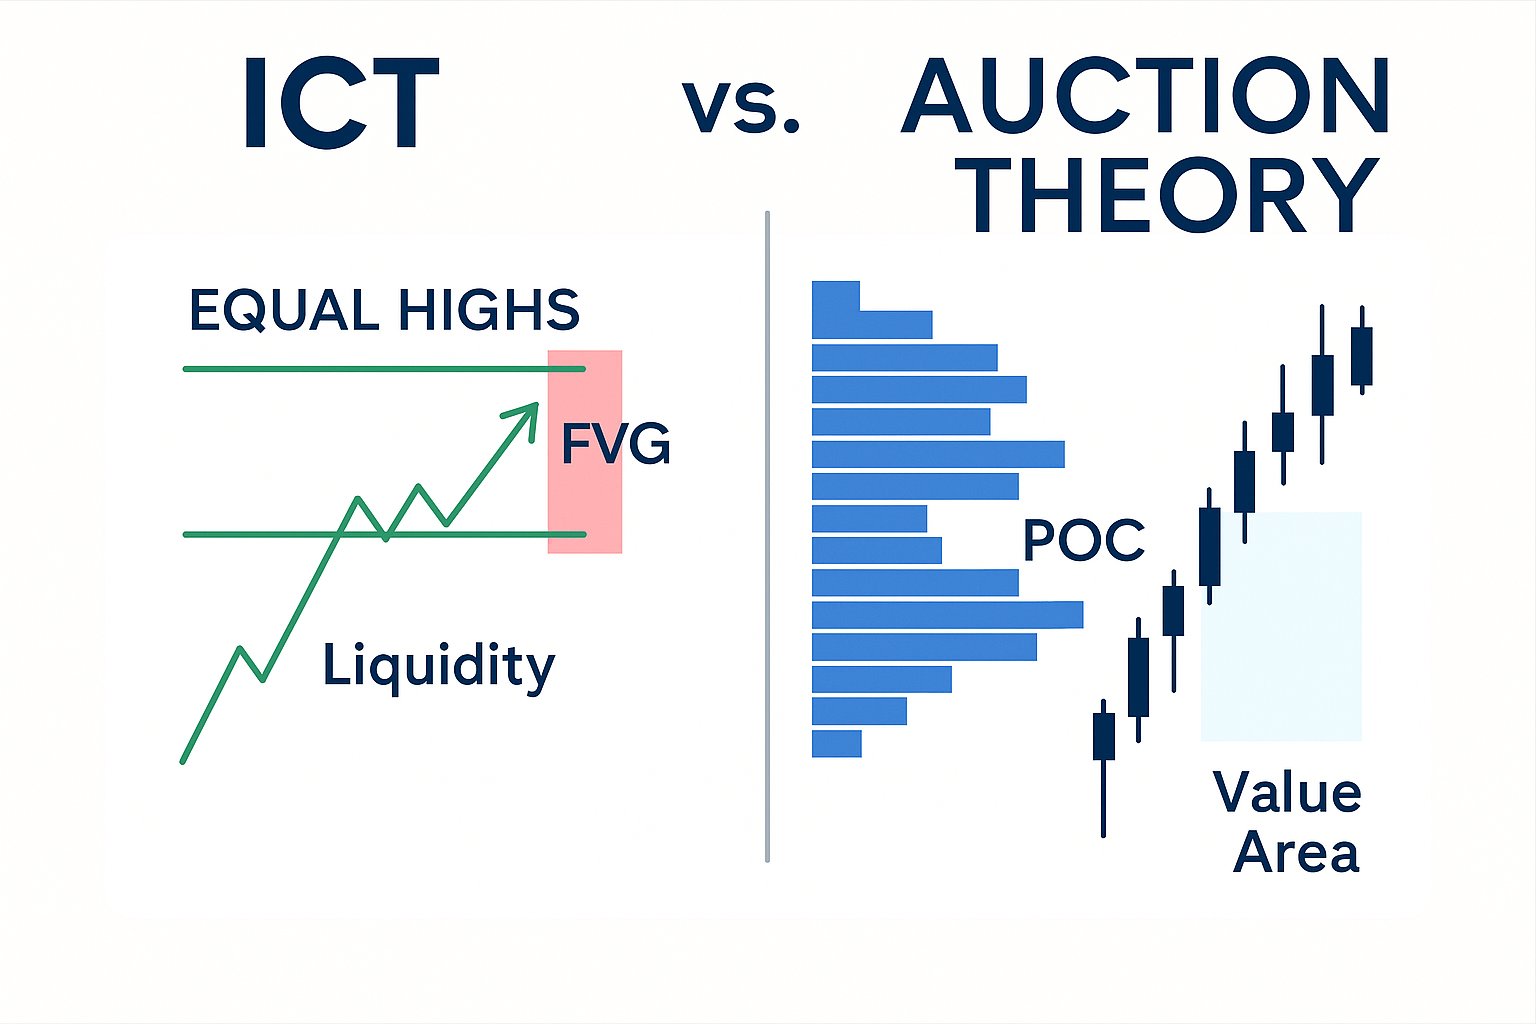
- A macro view of where liquidity is (equal highs/lows, breaker blocks, FVGs)
- A narrative to follow intraday (AM/PM session, Judas Swing, kill zones)
- A framework for waiting and anticipating smart money movement
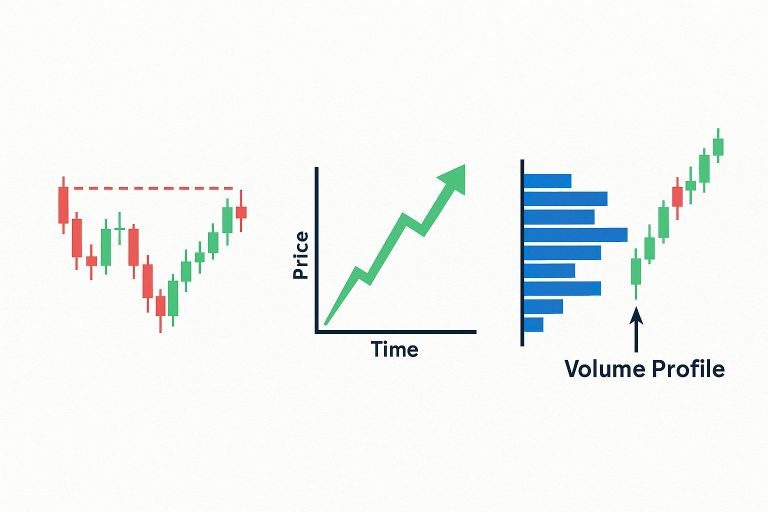
🟣 Volume Profile / Auction Theory gives you:
- A way to see where the market is building value
- Insight into imbalances, acceptance, and rejection zones
- A rule-based structural map of the session or day
🔵 Footprint gives you:
- Precise entries/exits at key ICT zones
- Clarity on absorption, trapping, and volume spikes
- Confirmation of intent before you commit to a trade
🔁 3. Real-World Example: Combining ICT + Volume Profile
Imagine you’ve identified a classic ICT “liquidity pool” above a prior high during the London close.
- ICT says: “Watch for a stop run and reversal here.”
- Volume Profile shows: “That high coincides with a Low Volume Node – rejection likely.”
- Footprint shows: Absorption on the offer, price wicks above, then aggressive selling.
➡️ All three methods converge, giving you higher conviction.
⚠️ Philosophical Differences
- ICT relies heavily on price action, narrative, and time.
- Volume/Footprint rely on objective volume data and don’t care about market structure per se.
- ICT often dismisses traditional volume tools — but mostly refers to basic volume bars, not advanced tools like Footprint or Volume Profile.
- If you’re strict ICT, you might avoid this. But if you’re like you — someone who feels something is missing in candles — this is your missing link.
🧭 My Advice for You
- Keep ICT as your higher time frame context.
- Use Volume Profile to map key reaction zones.
- Use Footprint to fine-tune execution and confirm intent.
The edge comes from knowing what each tool is telling you — and using it only where it adds clarity, not noise.
Would you like a visual example of how to combine these in a single trade idea, or should we go step-by-step into learning Volume Profile first?
You said:
We can take a visual example thank you.
ChatGPT said:
Perfect! Here’s a visual step-by-step walkthrough of how ICT, Volume Profile, and Footprint Charts can align beautifully in a single high-probability trade idea.
📈 Scenario: Classic ICT Liquidity Grab + Reversal Setup
🧠 Narrative:
- You’re watching EUR/USD on a New York session.
- Price has formed equal highs during the London session – a known liquidity pool.
- ICT expects a stop run above those highs, then a potential reversal.
🧩 Step 1: ICT Context (15–60 min Chart)
- 📌 Equal Highs at 1.0850 (liquidity magnet).
- 📌 You identify a Fair Value Gap (FVG) around 1.0830–1.0840 below.
- 📌 You plan to wait for price to run the highs and look for signs of rejection.
📊 Step 2: Volume Profile (Session-based)
- 🟣 Volume Profile of the London + NY session shows:
- A Low Volume Node (LVN) exactly at 1.0850 – price usually rejects from these.
- The Point of Control (POC) is around 1.0832 – fair value.
- 🔁 So now, the plan is:
- Let price spike into 1.0850 (above equal highs),
- Wait for signs of sellers stepping in,
- Target a move back to POC at 1.0832 or FVG at 1.0835.
🔍 Step 3: Footprint Chart (M1 or M3)
Now zoom in on a footprint chart (Delta or Bid x Ask):
- You see:
- Aggressive buy imbalance as price pushes into 1.0850.
- Then, on the next bar: Absorption at the highs (buyers trapped), and delta turns negative.
- Price begins to pull back as sellers take control.
💡 This is confirmation that smart money may have engineered the stop run and is now unwinding.
✅ Entry Plan:
- 📉 Short entry just below 1.0850 after footprint confirmation.
- 🛑 Stop: Just above the wick high (~1.0855).
- 🎯 Target: FVG zone or POC near 1.0832–1.0835.
🧠 Summary of Each Tool’s Contribution:
| Tool | What It Told You |
|---|---|
| ICT | Liquidity pool above equal highs; FVG target |
| Volume Profile | Rejection zone (LVN) + destination (POC) |
| Footprint | Confirmation of seller aggression after stop run |