Market Microstructure & Volume Analysis – Part 1
What’s Missing in Classic Candlestick Charts?
🔍 Why Candlesticks Aren’t Telling You the Whole Story
Traditional candlestick charts are useful — they show you open, high, low, and close over a period of time. But here’s the problem:
They don’t show how price moved.
Was the move driven by heavy buying or just a lack of sellers? Did price spend time trading at many levels or just spike through? Who was in control — buyers or sellers?
Candlesticks are blind to volume location and order flow.
They don’t reveal where trades happened, how many, or with what pressure.
This is the hidden dimension — and it’s why so many traders feel something is “off” when using candlesticks alone. You’re seeing the result, not the process.
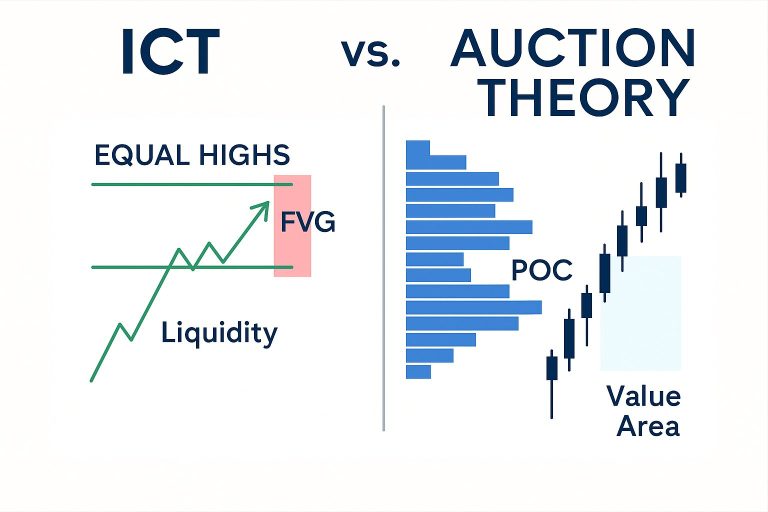
📊 What Is Volume Profile – And Why It Matters
Volume Profile is a tool that shows you how much volume was traded at each price level — not just over time.
Instead of asking:
“What did price do every 5 minutes?”
You ask:
“At which prices did the market actually do business?”
This helps you see:
- Where the market accepted price (high volume zones)
- Where it rejected price (low volume zones)
- The most traded price = POC (Point of Control)
- Value Area = the range where 70% of all volume occurred
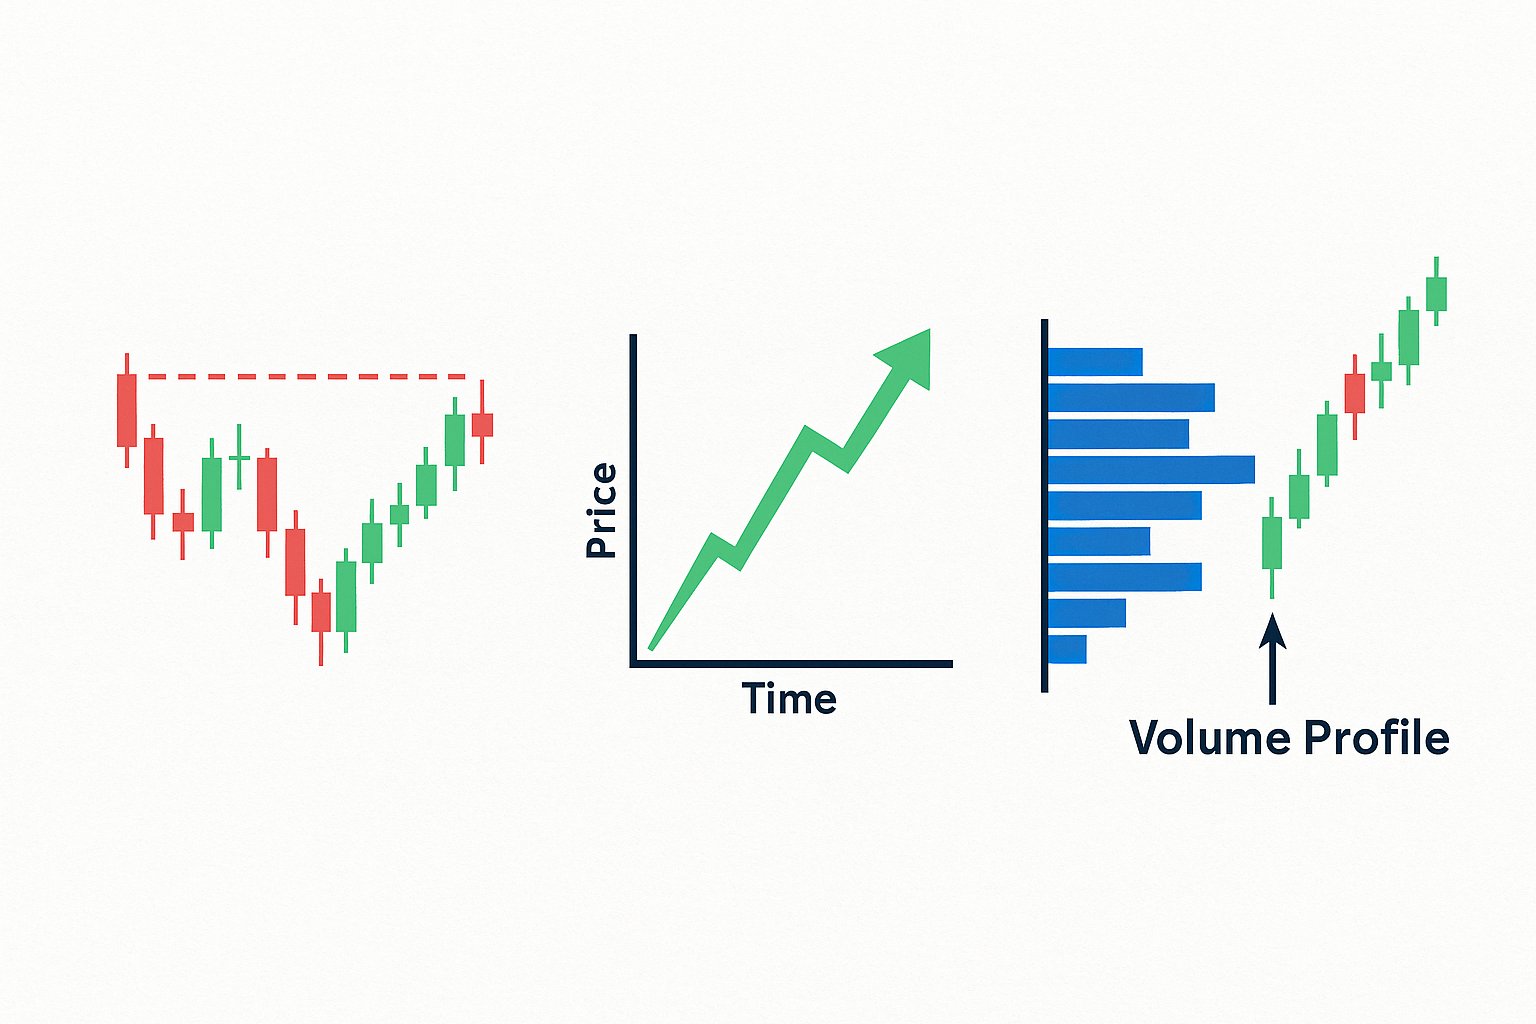
💡 Think of it as a horizontal histogram stacked next to your candles.
Whereas candlesticks give you a story in time, volume profile gives you a story in space (price levels).
⏳ Time-Based vs Volume-Based Analysis
Here’s the key difference:
| Type | What it Measures | Pros | Blind Spots |
|---|---|---|---|
| Time-Based Charts (e.g., 5-min candles) | Price movement over time | Easy to read, standard everywhere | Doesn’t show volume effort |
| Volume-Based Tools (e.g., Volume Profile, Footprint) | Where and how trades occurred | Reveals true price acceptance/rejection | Requires more learning and custom setup |
In short:
Time-based charts show when something happened.
Volume-based tools show why and how it happened.
📘 Your Personal Takeaway
You’ve already sensed this intuitively: candles lack something essential. That “missing feeling” is valid — it’s the absence of insight into buyer/seller effort.
With Volume Profile and Footprint Charts, you’ll start to see inside the candle — like looking through an X-ray of the market’s behavior.
✅ Example Setup: Volume Profile Rejection Trade
🧠 Context
You’re trading EUR/USD during the New York session.
You’re watching a Volume Profile from the London session (or the last complete session).
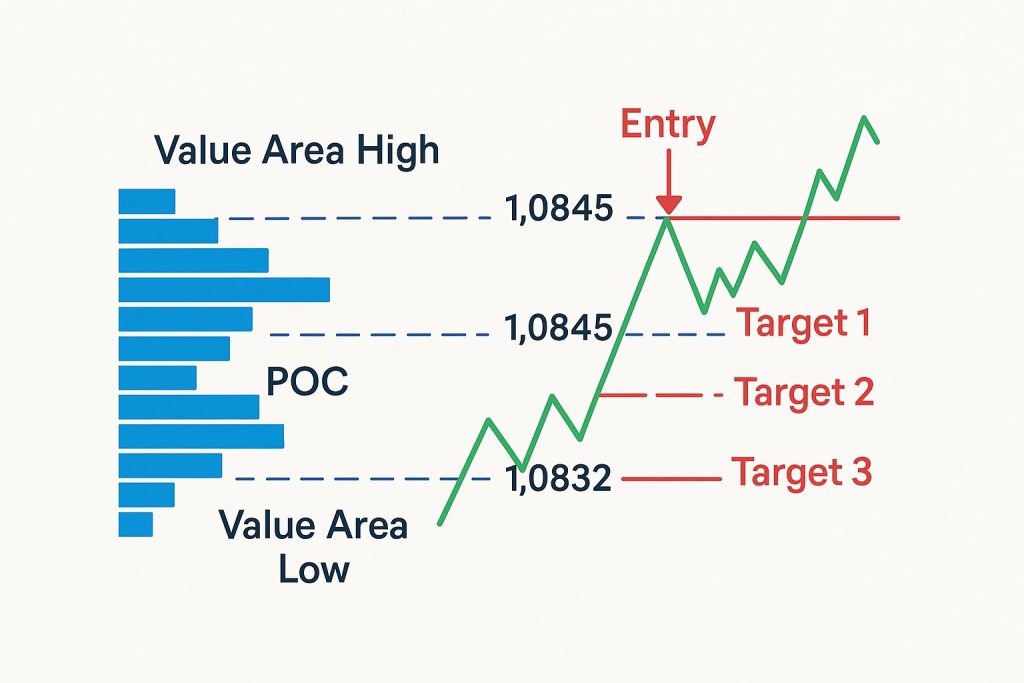
📊 What the Volume Profile Shows
| Feature | Price Level | Interpretation |
|---|---|---|
| POC (Point of Control) | 1.0832 | Market sees this as “fair value” |
| Value Area High (VAH) | 1.0845 | Upper boundary of accepted value |
| Value Area Low (VAL) | 1.0818 | Lower boundary of accepted value |
| LVN (Low Volume Node) | 1.0850 | Price was quickly rejected here = likely resistance |
🛠️ Your Trading Plan: Fade the Rejection
You notice price has been rising into 1.0850, where there’s a known LVN just above the value area high (VAH).
This tells you: Price is entering an area the market previously rejected. Sellers may step in.
🎯 Setup:
- Entry idea: Short near 1.0850 if price shows hesitation (e.g. reversal wick, footprint absorption, or lower timeframe SFP).
- Stop-loss: Just above 1.0855–1.0860 (to cover a stop run or wick).
- Target 1: Back into the Value Area High (1.0845).
- Target 2: The POC at 1.0832 – fair value.
- Target 3 (optional): Value Area Low (1.0818) – overshoot.
📉 How It Might Play Out
- Price pushes above VAH → enters low volume rejection area.
- You get footprint confirmation: buyers are aggressive, but no progress (delta divergence).
- You short.
- Price rotates back into value.
- First TP at VAH, second at POC.
🧠 Why This Works
- Markets are auction-based: when price enters an area of prior rejection (LVN), volume dries up — the market is likely to rotate back to where there is acceptance (value area).
- You’re not chasing price; you’re fading extremes with logic, not emotion.
📌 Bonus Tip:
If price breaks through the LVN and builds volume above it, this might indicate a new value area forming → time to cancel the setup or switch to breakout logic.